Xdebug & Docker & PHP video tutorial: Xdebug with PHP under Docker
In this video I suggest you discover how to use Xdebug when PHP is used using a Docker container.
Dock side
Docker Image Setup
The first step is to install Xdebug in the PHP container.
In the case of an alpine-based image:
FROM php:8.1-alpine
RUN apk add --no-cache $PHPIZE_DEPS \
    && pecl install xdebug-3.1.3 \
    && docker-php-ext-enable xdebug \
    && echo "xdebug.mode=debug" >> /usr/local/etc/php/conf.d/docker-php-ext-xdebug.ini \
    && echo "xdebug.client_host=host.docker.internal" >> /usr/local/etc/php/conf.d/docker-php-ext-xdebug.ini
WORKDIR /usr/src/myapp
CMD [ "php", "-S", "0.0.0.0:8000"]
If you are using an Ubuntu or Debian based image.
FROM php:8.1
RUN pecl install xdebug-3.1.3 \
    && docker-php-ext-enable xdebug \
    && echo "xdebug.mode=debug" >> /usr/local/etc/php/conf.d/docker-php-ext-xdebug.ini \
    && echo "xdebug.client_host=host.docker.internal" >> /usr/local/etc/php/conf.d/docker-php-ext-xdebug.ini
WORKDIR /usr/src/myapp
CMD [ "php", "-S", "0.0.0.0:8000"]
The 2 important points are the configuration of the Xdebug extension:
- xdebug.mode allows to choose the mode. By putting it in mode debug we activate the possibility of having a debug step by step with breakpoints.
- xdebug.client_host allows you to specify the host name of the server that Xdebug will try to dontact to initialize a debugging session.
Container configuration
For the Xdebug extension to be able to connect to the debugging session launched on the host, you will have to add the configuration option extra_hosts to plug in the host name configured in the option xdebug.client_host.
services:
  php:
    build: ./docker/php
    ports:
      - 8000:8000
    volumes:
      - ./:/usr/src/myapp
    extra_hosts:
      - host.docker.internal:host-gateway
And There you go ! Our container will now be able to connect and interact with our editor running on the host machine.
Browser side
The Xdebug extension is enabled by default but the session is not started for each request (except with the option xdebug.start_with_request=yes). It is possible to start the session using a cookie XDEBUG_SESSION which can be easily activated using an extension:
This extension will add a button that will allow you to activate the Xdebug session by automatically adding the Cookie to your requests.
Editor side
Finally, the last piece of the puzzle is configuring the editor to listen for connections made by the Xdebug extension.
VSCode
For Visual Studio Code you will need to install the PHP Debug extension then you can activate the configuration in the file launch.json placed in the file .vscode.
{
    "version": "0.2.0",
    "configurations": [
        {
            "name": "Listen for Xdebug",
            "type": "php",
            "request": "launch",
            "port": 9003,
            "pathMappings": {
                "/usr/src/myapp": "${workspaceFolder}"
            }
        }
    ]
}
It is important to define the pathMappings so that the editor can match the path sent by Xdebug to the path in the project.
PHPStorm
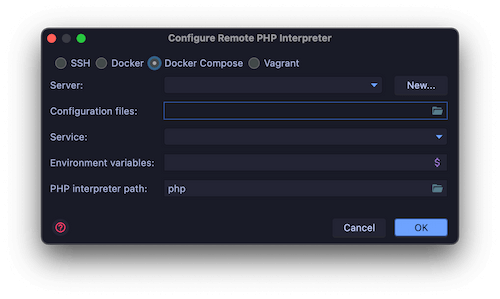
PHPStorm side it will be necessary to go in the preferences then PHP then configure a new interpreter using the docker configuration. PHPStorm will automatically detect your file docker-compose.yml in order to suggest you the list of services.

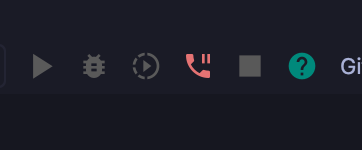
The Xdebug extension should be automatically detected by the editor and you can enable listening to the debug session in your toolbar via the icon that looks like a telephone handset.


